Windows10 Albumentationsの実験

Windows10 Albumentationsの実験

Albumentationsで画像処理

Albumentationsは機械学習において画像の水増しに使われるライブラリ。
画像内に雨や雪を降らせたりできるらしい。
前回使用したtorchvision.transformsと比較する。

1. 画像準備

前回の(Windows10 + pytorch torchvision.transformsの実験)で使用したテスト画像と同じものを使う。


2. 環境構築

torchvision.transformsのときに作った環境にAlbumentationsを追加する。
matplotlibを流用したかっただけなので新しく作っても良い。

https://github.com/albumentations-team/albumentations#conda
albumentations公式チームのgithubを参考にインストールする。

1
2
conda install -c conda-forge imgaug
conda install albumentations -c conda-forge

3. 実験

3.1. albumentationsの使い方

torchvision.transformsと同じ感覚で使えるが、渡す画像のフォーマットがPIL imageではなくnumpy.ndarrayなのでopencvで画像を読み込む。
albumentationsをインストールするといつのまにかopencvが入っているので安心。

1
transform = albumentations.〇〇()

で画像変換用のインスタンスができる。

1
img = transform(img)

とするとimgが変換される。

1
2
3
4
5
6
7
8
9
10
transform = albumentations.Compose([
albumentations.〇〇(),


albumentations.〇〇(),
])

img = transform(img)

とすると複数の変換処理を順番に実行する。

3.2. 実験結果1(よくあるやつ)

メジャーな画像処理4つと、それら全部を組み合わせたものを実験。
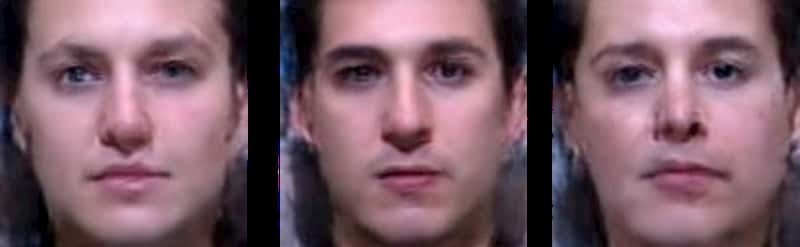
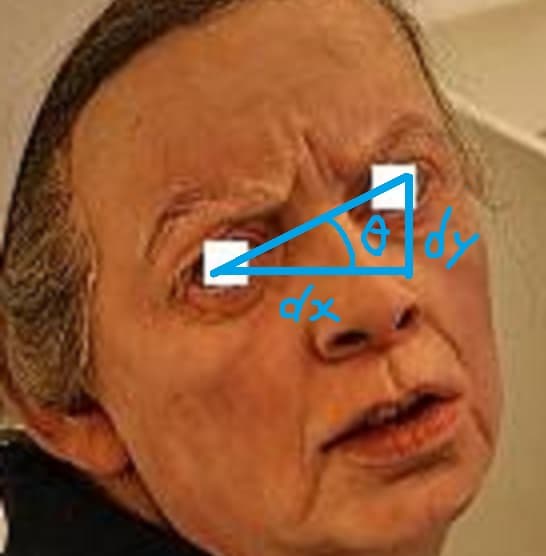
  • 1.回転
  • 2.輝度・コントラスト・彩度・色相変化
  • 3.パース変化
  • 4.部分消去
  • 5.全部

の、5パターン×3回の結果。


できるかぎり前回の処理と合わせたかったが妥協。
パース変化は特に違う。

前回(Windows10 + pytorch torchvision.transformsの実験)の結果↓


4.部分消去で使うRandomErasingの関数がalbumentationsには存在しないため自作する必要がある。
まさに同じことをしている方がいたため、この記事
https://nonbiri-tereka.hatenablog.com/entry/2020/05/18/090641
を参考に99%そのままコピー。変更したところは1行だけ。

渡したオブジェクトが変換されるのが嫌だったので、

1
img = img.copy()

apply()の初めに追加。

3.3. 実験結果2(天候変化)

albumentationsは画像内に雨や雪を降らせたりできる。
雨、雪に加えて光と影があったので、それらに加えて全部を組み合わせたものを実験。

  • 1.雨
  • 2.雪
  • 3.太陽光
  • 4.影
  • 5.全部


4. コード

実験に使用したコード。

4.1. 実験1(よくあるやつ)

1
2
3
4
5
6
7
8
9
10
11
12
13
14
15
16
17
18
19
20
21
22
23
24
25
26
27
28
29
30
31
32
33
34
35
36
37
38
39
40
41
42
43
44
45
46
47
48
49
50
51
52
53
54
55
import cv2
import matplotlib.pyplot as plt
import albumentations as A

###### transformの準備 ######
# 1.回転
transform_1 = A.Rotate(limit=30, p=1, border_mode=cv2.BORDER_REPLICATE)
# 2.輝度・コントラスト・彩度・色相
transform_2 = A.HueSaturationValue(hue_shift_limit=50, sat_shift_limit=50, val_shift_limit=50, p=1)
# 3.パース
transform_3 = A.IAAPerspective(p=1)
# 4.部分消去 参考(https://nonbiri-tereka.hatenablog.com/entry/2020/05/18/090641)
transform_4 = A.RandomErasing(p=1)
# 5.全部
transform_5 = A.Compose([
A.Rotate(limit=30, p=1, border_mode=cv2.BORDER_REPLICATE),
A.HueSaturationValue(hue_shift_limit=50, sat_shift_limit=50, val_shift_limit=50, p=1),
A.IAAPerspective(p=1),
A.RandomErasing(p=1),
])

###### 画像の準備 ######
img_path = "input.jpg"
img = cv2.imread(img_path)
img = cv2.cvtColor(img, cv2.COLOR_BGR2RGB)

###### 画像の変換 ######
img1 = transform_1(image=img)["image"]
img2 = transform_2(image=img)["image"]
img3 = transform_3(image=img)["image"]
img4 = transform_4(image=img)["image"]
img5 = transform_5(image=img)["image"]

###### 画像表示用のグラフ作成 ######
plt.subplot(1, 6, 1)
plt.imshow(img)
plt.subplot(1, 6, 2)
plt.imshow(img1)
plt.subplot(1, 6, 3)
plt.imshow(img2)
plt.subplot(1, 6, 4)
plt.imshow(img3)
plt.subplot(1, 6, 5)
plt.imshow(img4)
plt.subplot(1, 6, 6)
plt.imshow(img5)

# グラフの線を消す(やらないとなんか汚くなる)
for i in range(6):
plt.subplot(1, 6, i+1)
plt.axis('off')

###### 画像の表示・保存 ######
plt.savefig('output.png')
plt.show()

4.1. 実験2(天候変化)

1
2
3
4
5
6
7
8
9
10
11
12
13
14
15
16
17
18
19
20
21
22
23
24
25
26
27
28
29
30
31
32
33
34
35
36
37
38
39
40
41
42
43
44
45
46
47
48
49
50
51
52
53
54
55
import cv2
import matplotlib.pyplot as plt
import albumentations as A

###### transformの準備 ######
# 1.雨
transform_1 = A.RandomRain( p=1)
# 2.雪
transform_2 = A.RandomSnow(p=1)
# 3.太陽光
transform_3 = A.RandomSunFlare(p=1)
# 4.影
transform_4 = A.RandomShadow(p=1)
# 5.全部
transform_5 = A.Compose([
A.RandomRain(p=1),
A.RandomSnow(p=1),
A.RandomSunFlare(p=1),
A.RandomShadow(p=1),
])

###### 画像の準備 ######
img_path = "input.jpg"
img = cv2.imread(img_path)
img = cv2.cvtColor(img, cv2.COLOR_BGR2RGB)

###### 画像の変換 ######
img1 = transform_1(image=img)["image"]
img2 = transform_2(image=img)["image"]
img3 = transform_3(image=img)["image"]
img4 = transform_4(image=img)["image"]
img5 = transform_5(image=img)["image"]

###### 画像表示用のグラフ作成 ######
plt.subplot(2, 3, 1)
plt.imshow(img)
plt.subplot(2, 3, 2)
plt.imshow(img1)
plt.subplot(2, 3, 3)
plt.imshow(img2)
plt.subplot(2, 3, 4)
plt.imshow(img3)
plt.subplot(2, 3, 5)
plt.imshow(img4)
plt.subplot(2, 3, 6)
plt.imshow(img5)

# グラフの線を消す(やらないとなんか汚くなる)
for i in range(6):
plt.subplot(2, 3, i+1)
plt.axis('off')

###### 画像の表示・保存 ######
plt.savefig('output.png')
plt.show()

5. 参考

https://github.com/albumentations-team/albumentations#how-to-use
https://nonbiri-tereka.hatenablog.com/entry/2020/05/18/090641

Your browser is out-of-date!

Update your browser to view this website correctly. Update my browser now

×