matplotlibで棒グラフを複数系列並べる。
1 | Category = ["A", "B", "C", "D", "E"] # カテゴリ名 |
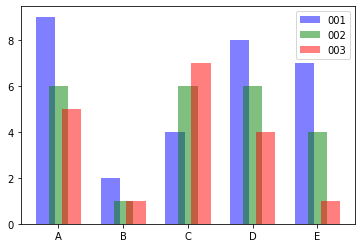
こんなデータがあったとして、理想はこれ↓

普通にこうすると
1 | from matplotlib import pyplot as plt |
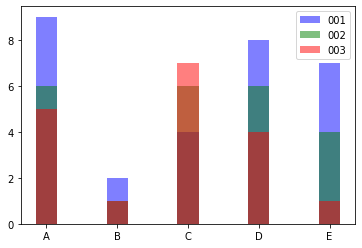
こうなる↓

???
matplotlib、棒グラフを同じ場所に重ねる。
1 | Category = ["A", "B", "C", "D", "E"] # カテゴリ名 |
こんなデータがあったとして、理想はこれ↓

普通にこうすると
1 | from matplotlib import pyplot as plt |
こうなる↓

???
matplotlib、棒グラフを同じ場所に重ねる。
Update your browser to view this website correctly. Update my browser now